Historical depth
Worked shifts, schedules, exceptions, edits, rate history — captured over time so trends mean something.
Charts and KPIs for hours, overtime, labor cost, and trends — built into the platform, powered by your own warehouse, and governed by the same row-level permissions as everything else.
No separate BI tool to buy, connect, and secure. Insights lives inside Perigee Cloud, reads from your warehouse, and applies each viewer's scope to every pixel — a supervisor sees their teams, an executive sees everything.
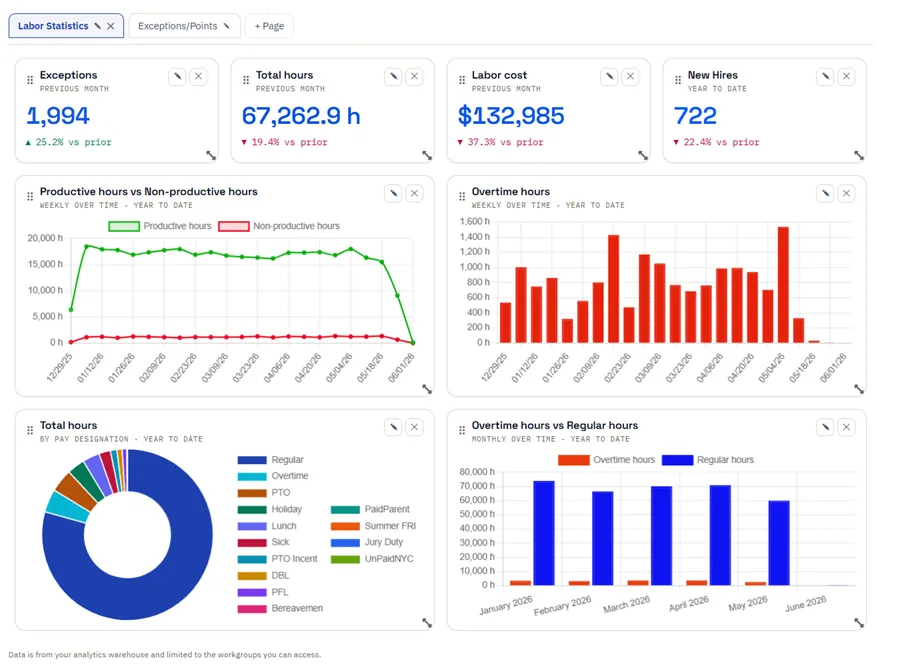
Every chart draws from the isolated data warehouse in your deployment — refreshed automatically from your connected systems.
Worked shifts, schedules, exceptions, edits, rate history — captured over time so trends mean something.
Scheduled ingest keeps the warehouse in step with your source systems — no manual refresh, no stale exports.
Pair dashboards with the report writer — build the exact export you need and subscribe to receive it hourly to monthly.
We'll walk you through Insights on data shaped like yours — overtime hot spots, trend lines, and the drill-downs behind them.